Pro cycling by numbers: conclusions from the last decade
Stats and graphs from pro cycling 2010-2019

In recent times there has been plenty of talk about the demise of road racing, with even former WorldTour riders like Peter Stetina, Laurens ten Dam and Lars Boom shifting their focus to gravel, and the EF Education First team adding an 'alternative racing' calendar to the mix.
But the traditional sector of professional cycling is still going strong, hardly losing a single day of racing between 2010 and 2019.
What has changed is where the races are, who they are for and who is racing them. Cyclingnews takes a deep dive into the UCI calendar, rankings and other stats to show that road is still kicking.
Race speeds
An analysis of overall distances and times* for the UCI WorldTour shows the burden of the calendar's expansion and shows that the peloton is human after all. While the overall WorldTour average speed was approximately 40.5kph, the annual average was a full 41.44kph over almost a quarter million kilometres in 2013.
The relationship between overall distance and race speeds is not linear – despite a huge jump in racing kilometres in the WorldTour with the expansion in 2017, the speeds were fairly flat through 2019.
* This data was limited to UCI WorldTour for brevity.
In an attempt to measure the difficulty of the Grand Tours and Giro Rosa, we looked at the gap between the leader and each rider in the top 10 (in seconds) to measure the spread of the GC.
Get The Leadout Newsletter
The latest race content, interviews, features, reviews and expert buying guides, direct to your inbox!
In the above graph, the closer the dots are to the bottom, the closer they are to the leader (smallest gap). The line on the box represents the 50th percentile while the ends of the box are the 25th and 75th percentiles. In layman terms, the taller the box, the more spread out the top 10 were, and vice versa.
For instance, Vincenzo Nibali won the 2013 Giro d'Italia by 4:43 over Rigoberto Uran, with the rest of the top 10 fairly closely packed within six minutes of Uran, but the 2016 Giro d'Italia also won by Nibali was very different, with the Italian only sneaking into the lead on stage 20, profiting off the misfortune of Steven Kruijswijk's crash on stage 18 and Esteban Chaves' jour sans on stage 20.
Similarly, the 2016 Tour de France might have been a blow-out by Chris Froome with four minutes on Romain Bardet, but 10th place Roman Kreuziger was only three minutes off the podium.
Play with the visualization by using the drop down list to select one of the Grand Tours, and hover to see which rider each dot represents.
Racing days
If you look at the total number of UCI race days* around the world and across all five categories: elite men, elite women, U23 men, and junior men and women, there were nearly the same number of race days in 2010 as there were in 2019. But that doesn't tell the whole story.
There were almost 1,500 days of UCI racing worldwide in both years but in 2010, the elite men's races took up 80.3% per cent of the entire calendar. By 2019, that was down to just under 73.2%. Meanwhile, women's elite racing was 8.2% of the total UCI race days at the start of the decade and grew to 15% by last year.
* Racing days for an event were calculated by subtracting end date from start date and adding 1. Grand Tours were adjusted to 21 days to remove rest days. Although the UCI changed its race classifications over the decade, earlier races were mapped from their class to their 2019 x.UWT, x.HC, x.1 or x.2 equivalents.
There is still a long way to go to equality but the growth in the elite women mainly offset declines in men's stage racing, adding 102 race days to their pro calendar. Women's pro racing days increased in every continent except Africa (which has no UCI races for women in either year), with the most gains in Europe with 46 days.
While the introduction of the UCI Women's WorldTour in 2016 might have increased the quality of racing, women were already making gains in 2012, with the number of races fluctuating ahead of the Olympic years but making steady gains over the three Olympic cycles in the last decade.
The elite men's category showed a decline or little growth in race days everywhere except Asia. Between one-day and stage races, the world lost 107 days of UCI elite men's race days.
One-day racing remained strong, gaining five days of racing worldwide: While Europe lost eight one-day racing days, there were modest increases in the other continents. However, stage racing took the hit across the globe, with 112 days of racing lost overall.
The biggest shift came in the 2.2-ranked stage races, which declined by a whopping 229 days of racing around the globe, while modest gains were made in the 2.HC and WorldTour categories, which added 32 and 25 days respectively.
The WorldTour expansion resulted in a 61.5% increase in one-day races and 18.5% increase in stage racing days at that level, while the 1.HC class gained almost half again as many with seven more days.
The 1.1 classification saw a decline of 20 days (23.5%) while there were eight more 1.2 races in 2019 than in 2010.
Stage racing declines

Lower level stage races are important for the development of young riders, providing them a taste of the kinds of efforts riders put in for the Tour de France. However, multi-day events are increasingly expensive to hold and take a lot more time and effort to produce.
Between 2010 and 2019, the total number of stage racing days went from 1,003 to 891 - an 11.2% decline, this could be due to knock on effects from the 2008 global economic crisis, but the slide has continued at the lowest levels in the elite men's category. Upgrades to higher UCI classifications only accounted for some of the decline and the vast majority of the days were lost altogether.
Europe saw the biggest decline in 2.2 race days, losing 85. Only 20 of the 2.2 elite men's stage races held in 2010 still existed in 2019. The majority of the survivors are in France (9 events). Four of the 2010 races shifted to the U23 or Junior men categories, three upgraded to UCI 2.1 status and one changed to a one-day 1.2-ranked race.
There were 16 new 2.2-ranked events introduced - most of them in Turkey (6) and France (4).
Spain lost all four of its 2.2 stage races, the Cinturó de l'Empordà, Cinturón Ciclista Internacional a Mallorca, Circuito Montañés and Vuelta Ciclista a León, while France lost three races: Mi-Août en Bretagne, Tour des Pyrénées and Tour du Gévaudan Languedoc-Roussillon.
The next biggest drop in this category came in the Americas, where 75 days of racing were lost - most in South America where all of the 2.2-ranked races in Bolivia and Brazil vanished along with the Vuelta Pilsen a Colombia and the Rutas de America in Uruguay.
Of the 2010 races in South and Central America, only seven survived to 2019: the Tour de Beauce was the only surviving North American event in this category. There were some bright points: six new races appeared on the continent somewhat mitigating the decline.
North America lost the two-day Univest Grand Prix but gained Joe Martin and Tour of the Gila to have a net gain of seven days.
The picture was different in Asia, where 54 days of 2.2-ranked racing went away but were offset by an increase of 56 days of UCI 2.1 stage races, and in Africa, where nine days shifted from 2.2 to 2.1.
The overall result is a reduction of 2.2-ranked stage race days from 211 in 2010 to only 146 days in 2019. In 2010, 19 different countries had a stage race of this category but by 2019 there were only 15 countries with 2.2-ranked events.
The decline in stage racing days has two factors: number of races held and length of races. The number of UCI 2.2 races for elite men went from 97 down to 75 and got 1.25 days shorter on average.
The number of UCI 2.1 races for men went up from 41 to 51 and gained 0.7 days. There are five more 2.HC races in 2019 than in 2010 but are a quarter day shorter now.
Women on the rise

The elite women's race calendar, by contrast, became much stronger over the course of the decade, making big gains in one-day races, going from just 34 UCI-sanctioned events to 90 over ten years. Stage races were equally robust for women, with 89 racing days in 2010 rising to 143 in 2019 – a 60.67% increase.
The most gains were made in Europe, with 46 additional race days over the decade – an increase of 42.6% - but strong growth also came in the Americas, where UCI race days went from a paltry three days to 38. Asia more than doubled its days of UCI racing for women cycling, adding 15 days and Oceania three to bring their tally to eight.
The only down side is races are getting shorter overall for women, with the average length of a WorldTour race going from 5.5 days in 2016 when the series started to 4.75 in 2019. Women gained three each 2.2 and 2.1-ranked events, but lost 0.77 and 1.58 days in length.
The new UCI junior women's category took off over the span. There were but two days of racing in Europe in 2010, and by 2019 junior women had 12 UCI-sanctioned race days.
Other men's categories
In contrast to the junior women, junior men lost ground in Europe, giving up 25 days of racing on the continent and seven in Asia.
U23 men gained 20 days in Europe and six in Africa, but lost four days in the Americas.
Internationalization of the peloton

Cyclingnews looked at the complete year-end individual rankings to see how many countries were represented across road cycling in each of the years across the last ten years.
The UCI's inclusion of Pro Continental and Continental teams in the World Ranking, introduced for elite men in 2015, vastly increased the number of countries in the rankings. From 2010 to 2014 the number was flat at 34 or 35, but exploded to 115 different nations by 2019.
Women's elite racing had already made gains from 58 countries to 75 by 2015, and rose to 91 by 2019.
Internalization of races
While the riders competing at the world level have become more diverse, the road racing calendar itself has seen little change over the decade: the elite men's field remains the most diverse, starting with 68 in 2010 and ending with 66 differently countries holding races in 2019.
The number of countries holding UCI-sanctioned elite women's races nearly doubled over the period, starting with 15 and ending with 28 nations.
France was still the centre of professional road cycling in 2019, with the most UCI race days in the world (all categories) at 236. Italy was second with 134 race days, while Belgium is third with 116.
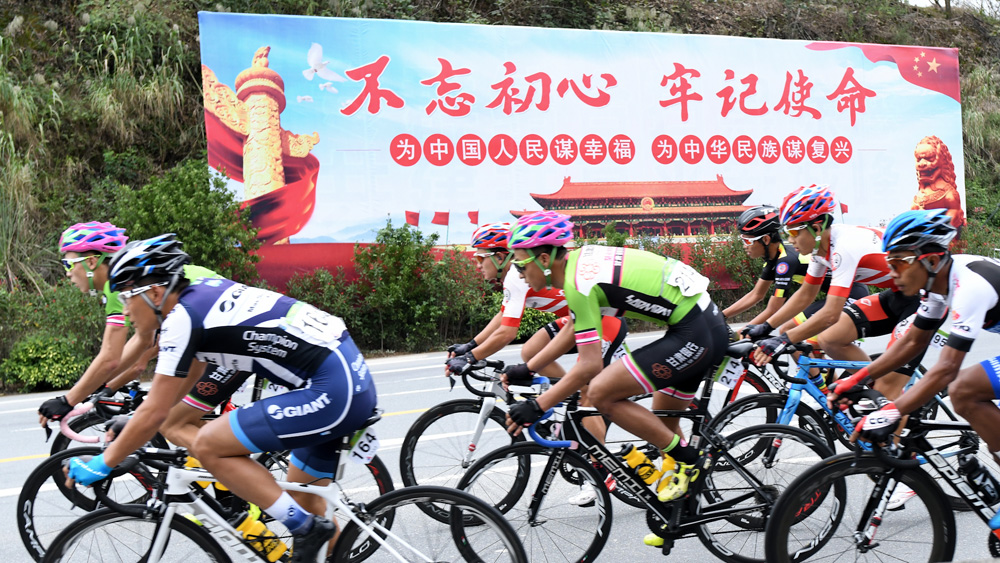
Looking at just elite men, France still had the most UCI race days at 177, while Spain moved into second with 75 men elite race days and Italy third with 74. China was fourth with 73.
Most successful nations
Strongest men's countries
Looking at the top 10 riders of the last decade in each of the Grand Tours, Spain has been the most successful with 71 top-10s (caveat, riders disqualified for doping are still included, so Alberto Contador, Ezequiel Mosquera, Juan José Cobo, etc., are still included). Colombia's recent success is obvious from this map, while Richard Carapaz puts Ecuador on the map thanks to his Giro win.
We can also look at how many riders each nation had in the top 100 of the UCI Rankings per year and see which countries were the 'hottest' over the decade.
Spain started at the top before being surpassed by Italy after Alberto Contador was banned for doping in the 2010 Tour de France. Italy climbed to the top in 2011 and remained there until France took over in 2014 – not because they had the best overall riders but their depth began to show with Jean-Christophe Peraud, Romain Bardet, Thibaut Pinot, and Tony Gallopin all in the top 100.
That didn't last, as Belgium surged in 2015 and 2016 and while Italy nudged them for most riders in 2017, the country climbed back to the top. Colombia bounced into the top 10 in 2013 and rose as high as fourth most in 2016.
Strongest nations for women's racing
The cycling world looks very different for the women's peloton, with most of the racing concentrated in Europe and a larger portion of the calendar in the US. France still had the most race days in 2019 with 24
The Netherlands and Italy dominated the UCI women's rankings throughout the decade, taking turns with the most riders in the top 100. Australia started and ended the decade in third, but dropped behind the United States during the midpoint.
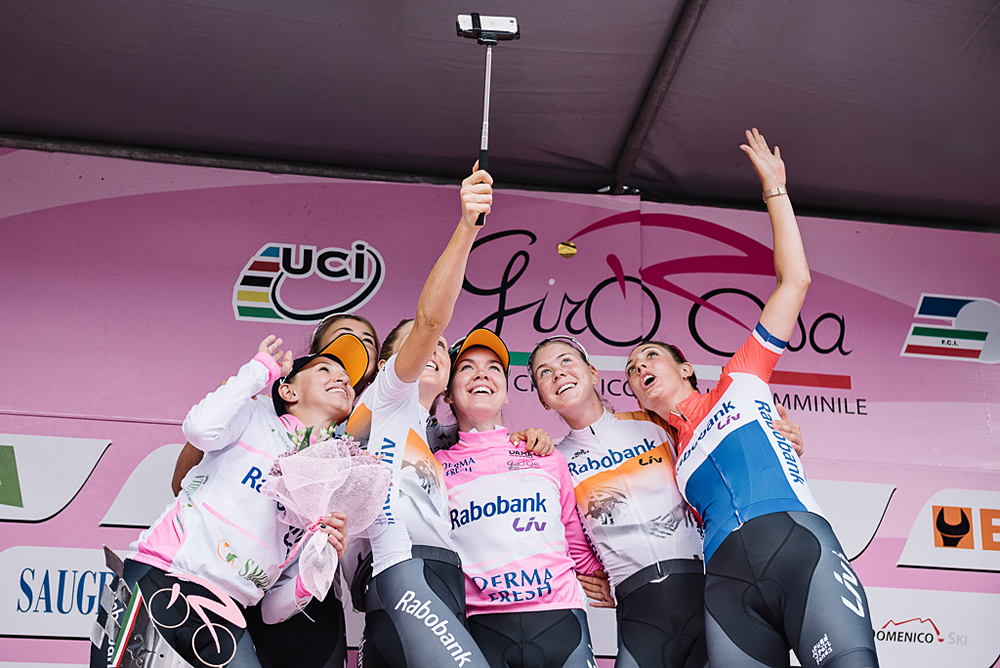
It's easy to see how the Dutch riders have won so many world championships, Giros and topped the rankings, with stars like Marianne Vos, Anna van der Breggen and Annemiek van Vleuten, but hard to see the depth of their programme until you look at 2018 when there were 20 riders from the tiny country in the top 100!
Would you like to play with the data yourself? Download the github repository. Data vis was done mostly with Flourish, and some data munging was done in Excel and is not in the repository.

Laura Weislo has been with Cyclingnews since 2006 after making a switch from a career in science. As Managing Editor, she coordinates coverage for North American events and global news. As former elite-level road racer who dabbled in cyclo-cross and track, Laura has a passion for all three disciplines. When not working she likes to go camping and explore lesser traveled roads, paths and gravel tracks. Laura specialises in covering doping, anti-doping, UCI governance and performing data analysis.